Most Viewed

Creating a Box Plot - No Outliers
Creating a box and whisker plot using dice rolls from a 20 sided dice.
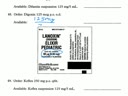
Review - Apothecary Measurement and Conversion - Unit 11
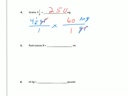
Apothecary Measurement and Conversion
Proportions and Similar Figures
Solving Proportions; Using proportions to solve similar figures; scale factor

Sampling Types & Design of Experiments Notes
Experiment vs. Observation, Sampling Types - Random, Systematic, Stratified, Cluster, Convenience

Linear Correlation - Example #3 (from Notes)
Discussion of Example from Notes - Problem #3 (NOT significant)

Comparing Box Plots
Identifying shape/skew and comparing 2 box plots. Uses samples of data from rolling a 20 sided and 10 sided dice.

Notes - Variation and Shape
Notes on general shape and spread of a set of data - from a graph or description

Hypothesis Testing - Steps 1-4 only Example (#5)
Steps 1-4 only of Problem #5

Creating a Box Plot - Outlier Test
Steps for creating a box plot, including testing for outliers and how the graph is affected when outliers are present.